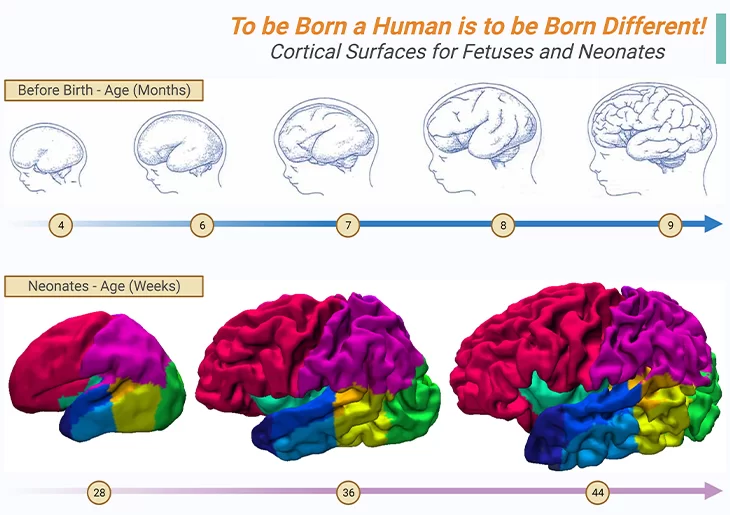
Figure 1. Anatomical Images of the Developing Cortex.
Cortical surfaces of preterm babies between sixteen and thirty-six weeks of pregnancy appears in greyish-blue (top panel), while babies in the first months of life are shown in color (bottom panel); example cortical surfaces for neonates at 28, 36, and 44 weeks post-mensural age (PMA) acquired on MRI machine and reconstructed in three dimensions. In the fetus, the first cortical folds appear at around six and a half months of gestation. These folds are the secret that our human brain uses to boost its surface area, and consequently the number of neurons, that too, without increasing the diameter of the skull beyond reason. Consequently, we are born with a small, immature brain, however, it magnified our chances of learning from interactions with our environment. Around 28 weeks of pregnancy, therefore, the human cortex begins to fold as shown in bottom panel. Its first or primary wrinkles are common to all primates; and appears at around 8 months of pregnancy. Thereafter, immediately the secondary and tertiary folds appear; and are unique to humans and more variable from one person to another. Thus, at birth, each baby’s brain already possesses its own individuality, i.e., its folds are just as unique as its fingerprints. In addition, in reality, the human cortex exhibits a singular characteristic, viz., the asymmetry of the two hemispheres, which is absent in other primates. Thus, “to be born a human is to be born different.” – by Stanislas Dehaene. {Images adapted from: Cachia A, et al., (2021) Front Neuroanat 15: 712862; Makropoulos A, et al., (2016) Neuroimage 125: 456.} [1 -2].
Introduction
In recent years, rapid advances in genetics and neuroimaging have provided many invaluable insights into the neural substrates underlying autism spectrum disorder (ASD) which is now known to be associated with neurodevelopmental variations in brain anatomy, functioning, and connectivity. In this context, here we concisely review insights into atypical brain development across the human lifespan in ASD, and respective neurodevelopmental differences in brain anatomy, functioning, and connectivity within the neural systems that underlie specific autistic symptoms and traits.
I. Brain Development in ASD
In contrast with neurotypical brain development and decline (Figure 1), as elaborated in our previous blog (cf. previous blog entitled as ‘The Neurotypical Brain versus the Autistic Brain: Neurotypical Brain Development and Function’), what is known so far about brain changes over the lifespan in individuals with ASD suggests an atypical trajectory.
Atypical Brain Development
(i) Early Brain Development
“Physically, the children were essentially normal. Five had relatively large heads.” – Leo Kanner (1943)
From the earliest descriptions of autism , Leo Kanner remarked that some but not all children with ASD had enlarged heads. From that moment on, numerous studies have evaluated head circumference in individuals with ASD, and a recent meta-analysis found that approximately 16% of individuals with ASD have macrocephaly, typically defined as head circumference larger than the 97th percentile [3]. This is consistent with previous reports that rates of ASD were associated with increased head circumference and findings of increased brain weight in postmortem brains of individuals with ASD
(Figure 2).
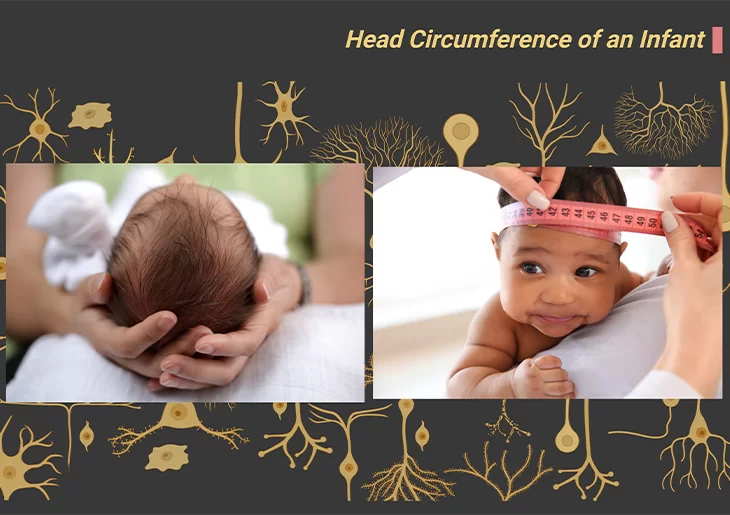
Figure 2. The Postnatal Brain Doubles in Size in the First Year of Life.
Measurement of head circumference, or occipital frontal circumference (OFC), reflects head growth and is a useful tool in tracking and monitoring childhood growth and development. Both in overall size, and also in volume, the brains of individuals with ASD show an abnormal pattern of growth and decline.
Macrocephaly/Megalencephaly: One of the well-established findings concerns the abnormally rapid brain growth in the first 18 months of life, referred to in the previous blog on brain structure in ASD (cf. previous blog entitled as ‘The Neurotypical Brain versus the Autistic Brain: Brain Structure in ASD’). For several years it was presumed that over-rapid growth in the earliest months of life was specific to the brain. However, more recent studies have evidently shown that increases in body height and weight are also abnormally rapid in infants who will eventually develop ASD [4].
At age 2;0 years, head circumference, and by implication the volume of the brain, is significantly larger than average in infants who will develop ASD. This indicates the fact that in infants with incipient ASD, grey matter (neurons) and while matter (glial cells; axon fibers) proliferate unusually rapidly during the first 18 months of life. Additionally, during the second half of the second year the normal process of synaptic pruning and cell loss due to programmed cell death do not occur (Figure 2; Box – 1).
Notably, the abnormally rapid brain growth does not continue, however. Between the ages of 2;0 and 5;0 years the rate of brain growth is normal, although total brain volume remains enlarged relative to that of typically developing children.
Megalencephaly, which refers to enlarged brain volume, has been evaluated using structural magnetic resonance imaging (sMRI), but because there are no population norms for brain volume, studies typically compare group-averaged brain volumes between subjects with autism and control subjects. A meta-analysis revealed that 9.1% of participants with ASD had brain overgrowth, or megalencephaly, which they defined as brain volume >2 standard deviations (SD) from study control subjects, and that cognitive ability and age were moderators of brain enlargement (Figure 3).
Particularly, those with severe cognitive impairments had larger effect sizes and higher rates of megalencephaly than those without cognitive impairment, and brain enlargement was most consistently observed in studies of younger children. In reality, numerous reports have demonstrated converging evidence for significantly enlarged brain volume in preschoolers. Studies of preschool-age boys with ASD suggest that megalencephaly is associated with higher rates of regressive onset and exposure to autism-specific maternal antibodies [5].
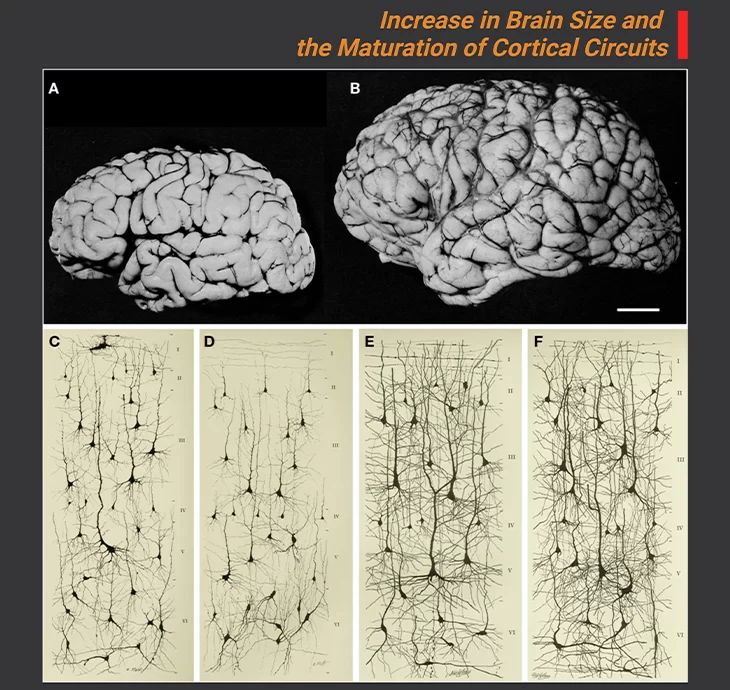
Figure 3. Increase in Brain Size and the Maturation of Cortical Circuits.
Photographic images of the brains of a one-month and six-year-old-child (A, B); The maturation of mental processes and motor skills is associated with an almost fourfold enlargement in brain size. This increment is accompanied by dramatic development in the complexity of the neuronal processes, which in turn is influenced by the genetic background (genetically ordained) and the environment (environmental determinants). This increase is obviously evident in the images of cortical neurons from the cerebral cortex of a one-month [(C) pars triangularis of gyrus frontalis inferior; (D) orbital gyrus] and six-year [(E) pars triangularis of gyrus frontalis inferior; (F) orbital gyrus] old child. Scale bar for (A, B) is 2 cm. {Image adapted from: DeFelipe J (2011) Front. Neuroanat. 5: 29.} [6].
Disproportionate megalencephaly: (a more conservative definition that identifies individuals with brain enlargement that is disproportionately large to their body size) has been observed in approximately 15% of boys with ASD and is associated with poorer cognitive outcomes [7]. At 3 years of age, no differences in intelligence quotient (IQ) were found between children with ASD with and those without disproportionate megalencephaly. Longitudinal assessment of these children 2 years later at age 5 reveled that the children with disproportionate megalencephaly made (a) fewer cognitive gains, (b) had significantly lower IQs, and (c) had a much higher rate of intellectual disability (IKD) than those without disproportionate megalencephaly. Thus, consistent with the meta-analytic findings cited previously, megalencephaly in ASD appears to be associated with ID and poorer prognosis.
(ii) Neurodevelopment Across the Human Lifespan
Furthermore, from adolescence into the late middle age, sMRI scans reveal abnormal decreases in total brain volume in most individuals with ASD, relative to neurotypical comparison groups [8]. Nevertheless, rare cases of persistent macrocephaly have been reported, conceivably associated with a lack of early synaptic pruning.
The spurt of brain growth that occurs in neurotypical teenagers may not happen in ASD teenagers, resulting in reduced brain volume. On the contrary, abnormally large decrease in brain volume during adulthood are more probably result from greater than normal loss of both grey and white matter as brain ages.
These findings also highlight the importance of accounting for the different neurodevelopmental stages when comparing individuals with ASD with typically developing controls because the rate of cortical development is not linear across the human lifespan, and precocious or delayed maturation in a group of individuals could lead to a substantial positive difference at one age and a substantial negative difference in another age.
For example, the amygdala is enlarged in toddlers and children with ASD, while no significant differences have been reported in adolescents with the disorders. However, overall, findings from neuroimaging studies suggest that atypical cortical development in ASD occurs in distinct stages that are dominated by an accelerated expansion of the cortical surface during childhood, and there is initial evidence of expansion of the cortical surface during childhood, and there is initial evidence that this expansion is followed by an acceleration in cortical thinning during adolescence and adulthood. If correct, these findings suggest that individuals with ASD might be at risk for accelerated cortical decline in later life.
Atypical Cortical Gyrification
If we accept the established fact that in ASD the brain undergoes a stage of accelerated expansion during childhood, then we can also expect the brain to differ in geometry from those without ASD [9]. This means that as the cortex expands, it eventually needs to fold to fit an increasing brain surface into the finite space of the skull (Figure 1; Figure 3). As a result, the brain in ASD would be expected to show an increase in cortical folding. Thus, the investigation of cortical folding would also allow us to better understand the causative mechanisms that are underpinning individual differences in ASD. For example:
- Axonal white matter fibers might exert a pulling force on the overlying neocortex, and so might modulate cortical folding extrinsically via mechanical tension.
- Alternatively, cortical folding might be mediated by developmental changes intrinsic to the cortical sheet, i.e., within the cortical grey matter.
- The formation of cortical gyri has been linked to accelerated expansion of the outer cortical layers relative to the deeper layers and to the microstructural complexity of the associated grey matter determined by (a) dendritic arborization, (b) synaptogenesis, and (c) the alignment of neurons in space.
Atypical cortical gyrification in the brain of individuals with ASD has been reported in several MRI studies. For example, a significantly higher incidence of cortical malformations have been reported in patients with ASD compared with health controls, including:
- Polymicrogyria, i.e., too many small folds, thought to arise from atypical prenatal brain maturation.
- Schizencephaly, i.e., clefts lined within the cortical grey matter.
- Macrogyria, i.e., increased size of gyri.
II. Brain Function in ASD
Considering the clear evidence of atypical brain structure and neurochemistry in individuals with ASD, brain function could not be anything other than atypical. In fact, much of the evidence of structural anomalies in the brains of patients with ASD comes from studies of brain function.
For example, if the emotion registering area of the brain are found to be inactive when someone is watching a video clip of a car crash or a bare-buckle fight, then it can be inferred that these brain areas are either structurally abnormal or disconnected from those parts of the brain registering the visual and auditory detail of the events depicted.
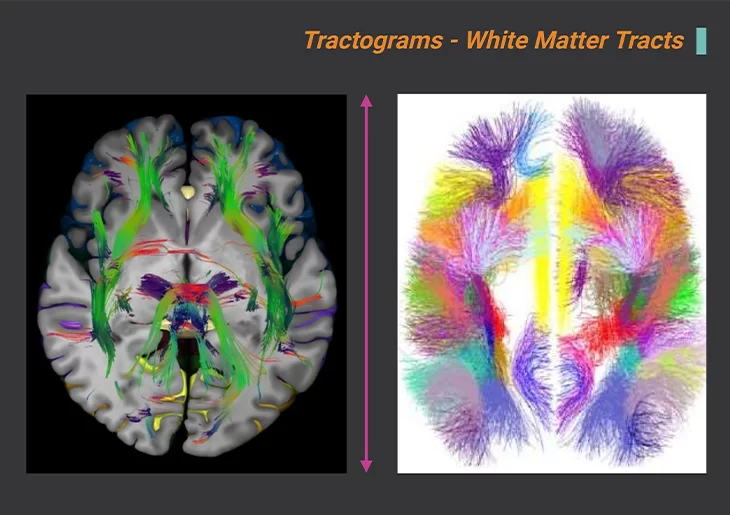
Figure 4. Bundles of Cortical Connections Measured in vivo, at Birth, Using Diffusion MRI.
Inferiorly dissected cerebrum at the intercommissural level showing white mater tracts (left panel). Tractograms, white matter tracts. Atlases of the largest U-bundles, hundred large reproducing U-fiber bundles (right panel). Used to test the hypothesis of a disturbance of the balance of long-range and short-range connections in ASD. {Image adapted from: Nowinski WL (2022) Neuroscience Informatics 2. 100085.} [10].
On the contrary, investigations of structural anomalies aid to identify functional anomalies, and this reciprocal relationship should be borne in mind when considering the more direct methods of assessing brain function (Figure 4); and as outlined below in section III.
What is known
Findings from studies of brain function in ASD supplement and reinforce what is known about atypical brain structure and neurochemistry. Studies using electroencephalography (EEG) and functional magnetic resonance imaging (fMRI), in particular, have done much to establish patterns of hyper- and hypo-connectivity with brain circuits with particular relevance for ASD (Figure 4) [11]. For example:
- both EEG and fMRI have been used to investigate brain structures involved in face processing, a key component of the social brain, in individuals with ASD.
- fMRI was used in studies to investigate whether or not the typical neural correlates of the default mode network (DMN) are active in individuals with ASD when carried out DMN-related tasks.
- As well as fMRI was used to investigate disconnectivity within the dopaminergic reward system, or salience network.
III. Methods of Assessing Brain Function in Individuals with ASD
(1) Electroencephalography (EEG): Method to record electric signal due to brain activity. The signal is recorded from the electrodes on scalp, skull, cortical surface, or in brain tissue. It involves placing electrodes on the skull and measuring brain electrical activity in response to certain stimuli (evoked response potentials, or ERPs) or in resting situations. Sort of invasive, however, given careful preparation, can be used with very young or vulnerable individuals, as well as with older children or adults (Figure 5).
(2) Magnetoencephalography (MEG): Method to record magnetic signal due to brain activity. A high sensitivity magnetometer, referred to as a Superconducting QUantum Interference Device (SQUID), is used to measure the weak signal. MEG measures magnetic fields generated by electrical activity in the brain to assess the brain’s response to particular stimuli. For technical reasons it is more sensitive than EEG. It is also less invasive than EEG. The person being assessed sits in a comfortable chair with their head in what looks like a hair drying of the kind used in hairdressing salons.
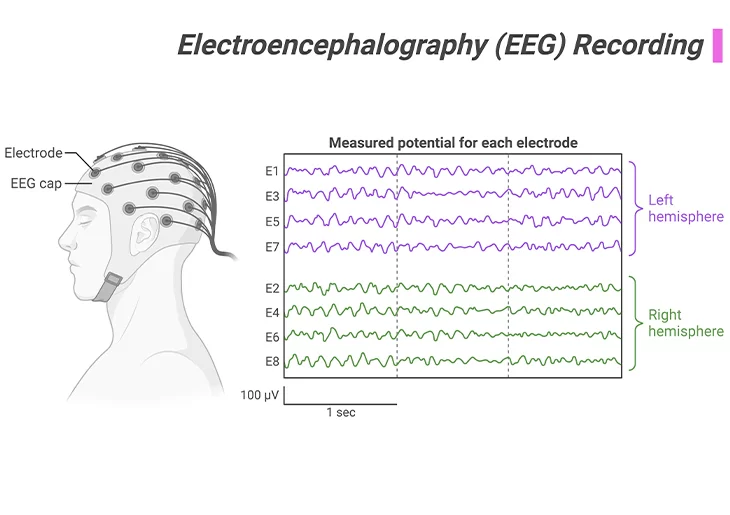
Figure 5. Electroencephalography (EEG) Recording.
Method to record electric signal due to brain activity. The signal is recorded from the electrodes on scalp, skull, cortical surface, or in brain tissue. It involves placing electrodes on the skull and measuring brain electrical activity in response to certain stimuli or in resting situations. Somewhat invasive, but given careful preparation, can be used with very young or vulnerable individuals, as well as with older children or adults.
(3) Functional Magnetic Resonance Imaging (fMRI): The use of nuclear magnetic resonance in order to measure the hemodynamic changes related to neural activity. Similar to sMRI, but measures levels of ongoing brain activity rather than brain structure. The person being scanned is generally asked to undertake a particular task designed to involve a particular function, such as watching an emotion-arousing video or memorizing faces.
(4) Positron Emission Tomography (PET Scan): Method to measure local blood volume that is based on sensitivity for the emission of positrons from an injected radioactive tracer . Can be used to measure levels of activity in specific brain regions during specific activities. However, because PET scans use radioactive materials as a ‘tracer’ – this method of assessing brain function is generally used for clinical purposes rather than for research.
(5) Single Photon Emission Computed Tomography (SPECT): Similar to PET scan method, it assesses blood flow using a radioactive tracer, from which to infer relations between brain activity and specific behavioral functions. It is mainly used for clinical purposes, and rarely for research purposes.
The take-home messages are: Thus far, in our series of blogs pertaining to the neurotypical brain versus the autistic brain, we have compared various aspects about the structure, neurochemistry, development, and function of the brain. Here we recapitulate the salient points that are concerning what is known about the brain correlates of autism-related abilities and disabilities.
- It is commonly accepted that there is abnormal connectivity within and between various brain regions (both local and global) and structures.
- Both hyper- and hypo-connectivity occurs.
- It is generally thought that hyper-connectivity within local brain networks is associated with isolated peaks of ability, while hypo-connectivity between widely distributed regions or structures is associated with ASD-related behavioral impairments or anomalies.
- Atypical connectivity in the brains of individuals with ASD possibly results from abnormalities in the density of grey matter and/or white matter in specific regions or structures, occasionally too much, occasionally too little.
- Abnormal densities of grey matter have been found in the cerebral cortex, the cerebellum, and in subcortical structures.
- Sometimes nerve tracts are under-developed, with loss of coordinated activity between structures.
- At cellular level, the generator, transmitter, and/or receptor cells of certain neurochemical systems have been found to be sparse or malfunctioning.
- Neurochemical systems, with the balance between excitatory and inhibitory substances, such as GABA and glutamate, as well as the ‘social bonding’ hormones oxytocin and vasopressin, are also affected.
Summary and Conclusions
Over the course of past two decades, neuroimaging studies have provided many significant insights into the pathological changes that occur in the brain in ASD in vivo. Most of all, they have shown that ASD is accompanied by an atypical trajectory of brain maturation, which gives rise to differences in neuroanatomy, functioning, and connectivity within the wider neural systems that probably mediate autistic symptoms and traits. However, the development of the brain in ASD is complex and is mediated by numerous genetic and environmental factors, and their interactions; in an epigenetic fashion, i.e., an interface between the genome and environmental influence.
Did You Know? Folate Receptor Autoantibodies (FRAAs) may impede proper folate transport.
Folate (vitamin B9) is very important for your child’s brain development!
During pregnancy, it helps prevent neural tube defects and plays a big role in forming a normal and healthy baby’s brain and spinal cord. Folate also helps cells divide and assists in both DNA and RNA synthesis.
Emerging research suggests that the presence of FRAAs negatively impacts folate transport into the brain.
- Recent studies reveal that a large subgroup of children with autism spectrum disorder (ASD) have FRAAs.
- This suggests that a possible disruption in folate transport across the blood-cerebrospinal fluid (CSF) barrier may potentially influence ASD-linked brain development.
- Screening for the FRAAs in your child should be part of your early intervention strategies.
Is there a test for identifying Folate Receptor Autoantibodies (FRAAs)?
Yes, there is a test – The Folate Receptor Antibody Test (FRAT®) has emerged as a diagnostic tool for detecting the presence of FRAAs.
It is important to screen at an early age or as soon as possible as there may be corrective measures available. Please consult your physician for further information.
To request a test kit, click on the button below.

For information on autism monitoring, screening and testing please read our blog.
References
- Cachia A, Borst G, Jardri R, Raznahan A, Murray GK, Mangin JF, Plaze M. Towards Deciphering the Fetal Foundation of Normal Cognition and Cognitive Symptoms From Sulcation of the Cortex. Front Neuroanat. 2021 Sep 28;15:712862. doi: 10.3389/fnana.2021.712862. PMID: 34650408; PMCID: PMC8505772.
https://pubmed.ncbi.nlm.nih.gov/34650408/ - Makropoulos A, Aljabar P, Wright R, Hüning B, Merchant N, Arichi T, Tusor N, Hajnal JV, Edwards AD, Counsell SJ, Rueckert D. Regional growth and atlasing of the developing human brain. Neuroimage. 2016 Jan 15;125:456-478. doi: 10.1016/j.neuroimage.2015.10.047. Epub 2015 Oct 21. PMID: 26499811; PMCID: PMC4692521.
https://pubmed.ncbi.nlm.nih.gov/26499811/ - Sacco R, Gabriele S, Persico AM. Head circumference and brain size in autism spectrum disorder: A systematic review and meta-analysis. Psychiatry Res. 2015 Nov 30;234(2):239-51. doi: 10.1016/j.pscychresns.2015.08.016. Epub 2015 Sep 28. PMID: 26456415.
https://pubmed.ncbi.nlm.nih.gov/26456415/ - McKeague IW, Brown AS, Bao Y, Hinkka-Yli-Salomäki S, Huttunen J, Sourander A. Autism with intellectual disability related to dynamics of head circumference growth during early infancy. Biol Psychiatry. 2015 May 1;77(9):833-40. doi: 10.1016/j.biopsych.2014.08.008. Epub 2014 Aug 22. PMID: 25444163.
https://pubmed.ncbi.nlm.nih.gov/25444163/
- Nordahl CW, Braunschweig D, Iosif AM, Lee A, Rogers S, Ashwood P, Amaral DG, Van de Water J. Maternal autoantibodies are associated with abnormal brain enlargement in a subgroup of children with autism spectrum disorder. Brain Behav Immun. 2013 May;30:61-5. doi: 10.1016/j.bbi.2013.01.084. Epub 2013 Feb 8. PMID: 23395715; PMCID: PMC3641177.
https://pubmed.ncbi.nlm.nih.gov/23395715/
- Defelipe J. The evolution of the brain, the human nature of cortical circuits, and intellectual creativity. Front Neuroanat. 2011 May 16;5:29. doi: 10.3389/fnana.2011.00029. Erratum in: Front Neuroanat. 2013;7:10. PMID: 21647212; PMCID: PMC3098448.
https://pubmed.ncbi.nlm.nih.gov/21647212/
- Amaral DG, Li D, Libero L, Solomon M, Van de Water J, Mastergeorge A, Naigles L, Rogers S, Wu Nordahl C. In pursuit of neurophenotypes: The consequences of having autism and a big brain. Autism Res. 2017 May;10(5):711-722. doi: 10.1002/aur.1755. Epub 2017 Feb 27. PMID: 28239961; PMCID: PMC5520638.
https://pubmed.ncbi.nlm.nih.gov/28239961/
- Courchesne E, Campbell K, Solso S. Brain growth across the life span in autism: age-specific changes in anatomical pathology. Brain Res. 2011 Mar 22;1380:138-45. doi: 10.1016/j.brainres.2010.09.101. Epub 2010 Oct 1. PMID: 20920490; PMCID: PMC4500507.
https://pubmed.ncbi.nlm.nih.gov/20920490/
- Ecker C, Bookheimer SY, Murphy DG. Neuroimaging in autism spectrum disorder: brain structure and function across the lifespan. Lancet Neurol. 2015 Nov;14(11):1121-34. doi: 10.1016/S1474-4422(15)00050-2. Epub 2015 Apr 16. PMID: 25891007.
https://pubmed.ncbi.nlm.nih.gov/25891007/
- Nowinski WL. NOWinBRAIN 3D neuroimage repository: Exploring the human brain via systematic and stereotactic dissections. Neuroscience Informatics. 2022 2;3:100085. doi.org/10.1016/j.neuri.2022.100085.
https://www.sciencedirect.com/science/article/pii/S2772528622000474
- Aoki Y, Abe O, Nippashi Y, Yamasue H. Comparison of white matter integrity between autism spectrum disorder subjects and typically developing individuals: a meta-analysis of diffusion tensor imaging tractography studies. Mol Autism. 2013 Jul 22;4(1):25. doi: 10.1186/2040-2392-4-25. PMID: 23876131; PMCID: PMC3726469.
https://pubmed.ncbi.nlm.nih.gov/23876131/


