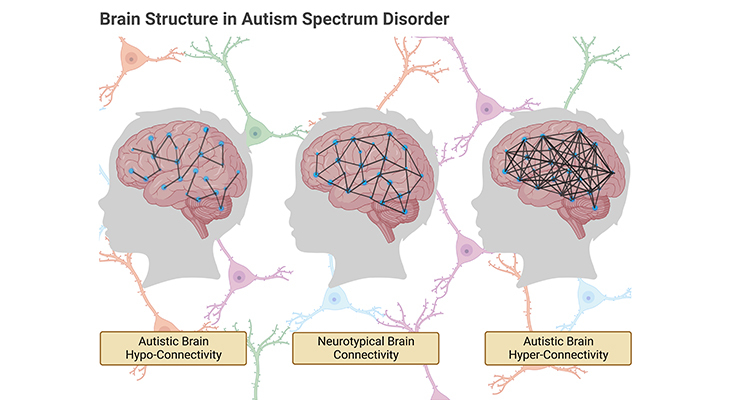
Figure 1. Atypical Pattern of Connectivity in Autism Spectrum Disorder (ASD): Atypical patterns of connectivity in ASD derive from abnormalities in the density, distribution, and cellular construction of grey and white matter in the brain. (i) Hyper-connectivity occurs, where these abnormalities consist of unusually dense growth of neurons and their projections. (ii) Hypo-connectivity occurs, where these abnormalities consist of unusually sparse growth of neurons, their projections, and/or their supporting glial cells. Both hyper- and hypo-connectivity have critical effects on behavior.
Introduction
Autism spectrum disorder (ASD) is a heterogeneous neurodevelopmental condition that affects 1 in 36 children aged 8 years (≈ 4% of boys and 1% of girls) in the United States. Diagnosis is explicitly based on the presence of characteristic behavioral impairments (i.e., early-onset difficulties in social communication and unusually restricted, repetitive behaviors and interests) that emerge in the second year of life and thus is not typically made until 3 to 4 years of age. Current studies of early brain and behavior development have provided valuable new insights into the nature of this condition. Most importantly, autism-specific brain imaging features have been identified as early as six months of age, and age-specific brain and behavioral changes have been revealed across the first two years of life, highlighting the developmental nature of ASD [1].
What is Known
1. Brain Size and Volume:
One of the most consistent findings from early studies of brain development is that people with ASD show an abnormal pattern of growth and decline, both in overall size, and also in volume (Figure 2; Box – 1). Specifically:
- Head circumference (and by implication brain size) is normal, or slightly below normal in the first months of life.
- However, abnormally faster growth associated with increased head size occurs from the second year of life through the toddler years until adolescence, and the degree of abnormal growth correlating with the severity of clinical features [2].
- The observed increase in brain size and volume through childhood results from an excess of grey matter throughout the brain (both cortical surface area and cortical thickness), with little evidence of regionally specific effects [3].
The Postnatal Brain is an Unfinished Project!
At birth, the human brain weighs on average about 350 g – that is about a third of the average adult brain, which weighs about 1,300 to 1,400 g [4]. In fact, the postnatal (after-birth) brain is an unfinished project. That is why the baby at birth has been described aptly as an ‘external fetus,’ which confers a sense of the vulnerability and the dependency of the baby.
An enormous amount of development will take place during the initial few years of life. It has been suggested that the brain increases in volume by 100% in the first year of life (Figure 2). However even after infancy the project is not finished. The brain continues to grow, mature, and change in structure and function until we are at the end of our 20s, i.e., around adolescence.
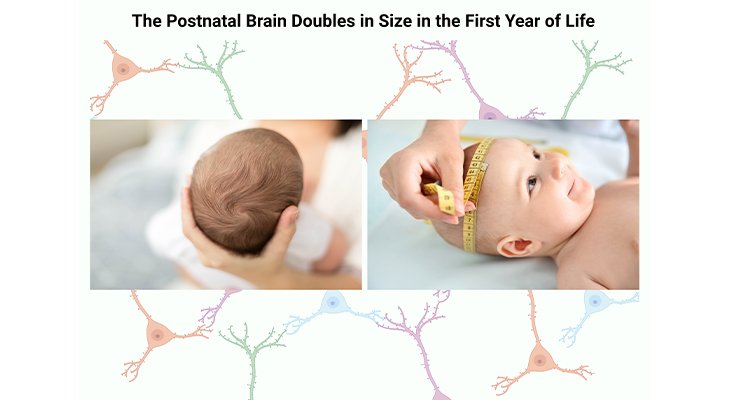
Figure 2. Measurement of Head Circumference, or Occipital Frontal Circumference (OFC), is a reflection of head growth and is a useful tool in tracking and monitoring childhood growth and development. Both in overall size, and also in volume, the brains of individuals with ASD show an abnormal pattern of growth and decline.
Connecting up the Brain
Even though most neurons are generated while we are still in the womb, the connections of these neuronal cells, known as synaptogenesis, occur postnatally. And most importantly, this occurs at different rates in different regions of the brain. As the connections in the head develop, consequently the size of the head itself requires to grow. As a result, it expands by about 14 cm on average during the first two years of life outside the womb and then by an additional 7 cm during early childhood and adolescence [5] (Figure 2).
Box-1
The Postnatal Brain is an Unfinished Project!
- Neural tube that develops into the brain, is almost completely developed by three to four weeks after conception.
- New neurons can be produced at the rate of 250,000 per minute.
- The brain doubles in size in the first year of life.
- The brain increases in volume by 100% in the first year of life.
- By the age of two we have twice as many connections in our brain as we will have as an adult.
- At birth, the human brain weighs on average about 350 grams, i.e., about a third of the average adult brain, which weighs about 1,300 to 1,400 grams.
2. Brain Connectivity:
In general, it is recognized that the set of behaviors that define or commonly present in ASD are associated with abnormal brain connectivity (Figure 1). In recent decades, several seminal studies have demonstrated anomalous brain connectivity to be of central importance for an understanding of the brain bases of autism, and its role as the major structural as well as functional anomaly in the brain of people with ASD is not contested anymore.
Atypical patterns of connectivity in ASD derive from abnormalities in the density, distribution, and cellular construction of grey and white matter in the brain, leading to either hyper-connectivity or hypo-connectivity (Figure 1).
- Hyper-connectivity happens, where these abnormalities consist of unusually dense growth of neurons and their projections, whereas,
- Hypo-connectivity happens, where the abnormalities consist of unusually sparse growth of neurons and their projections.
Both hyper- and hypo-connectivity have critical effects on behavior. For example:
- Hyper-connectivity underlies narrowed and sometimes idiosyncratic attentional focus, and is associated with special talents and splinter skills [6], on the other hand,
- Hypo-connectivity is associated with the system-wide impairments recognized in the following section on ‘Abnormal Circuitry.’
Even though the existence and significance of abnormal brain connectivity in ASD is no more in doubt, there remain certain uncertainties concerning the atypical patterns of connectivity, for example:
- Uncertainties as to the relative importance of hyper- in contrasted to hypo-connectivity in ASD.
- Concerning the nature of the abnormalities, i.e., whether associated with increases or decreases of (a) grey matter, or (b) white matter, or (c) both.
3. Cerebral Cortex Abnormalities:
There is clear evidence implicating atypicality in the density of grey and white matter in individuals with ASD [7]. This evidence derives (a) partly from studies of the exterior surfaces of the brain and (b) partly from studies of the cellular structure of cortical regions.
Studies utilizing measures of the exterior surfaces of the brain have shown abnormalities in all of the following:
- The total surface area of the cortex.
- The thickness of the cortex at various sites.
- The gyrification (i.e., the degree of folding) of the cortical surfaces.
Nonetheless, the precise anomalies of cortical surface area, thickness, and gyrification that have been reported are numerous and varied, because the groups studied have differed in age, gender, and functioning levels of ASD.
Studies of the cellular structure of the minicolumns of grey and white matter in the cerebral cortex of individuals with ASD also reliably show abnormalities [8]. The consensus in the literature findings is that:
- Minicolumns are more numerous but smaller and narrower than normal in individuals with ASD, at least at certain stages of life.
- The boundaries between grey and white matter within minicolumns and their projections are less well differentiated than normal, diminishing the efficiency of communication between minicolumns in different cortical regions.
- Minicolumns aberrations in ASD are linked with enhanced processing of detail (associated with hyper-connectivity) but impaired executive control (associated with hypo-connectivity).
4. Cerebellar Abnormalities:
Structural magnetic resonance imaging (sMRI) and post-mortem studies reveal that the grey matter in the cerebellum is decreased relative to the neurotypical brain. In the cerebellum, the most significant finding that has been demonstrated and stood the test of time is, reduction in the number of Purkinje cells [9]. Considering the role of Purkinje cells in the inhibitory control of neural activity, reduced inhibition deriving from cerebellar abnormalities has consequently disruptive effects not only on motor behavior, but also on cognitive, affective, as well as sensory behaviors.
5. Abnormal Circuitry:
The region of cortical and subcortical structures within which, or between which, abnormalities of grey and white matter are most consistently observed, are predictably, those that are components of widely distributed brain circuits subserving behaviors that are aberrant in people with ASD [10].
Circuits with likely or potential relevance to autism include, what are termed:
- The salience network (SN), involved in selective attention, attention switching, and goal setting.
- The default mode network (DMN), involved in introspection (thinking about themselves), thinking about the future (planning for the future), and mentalizing and theory of mind (thinking about others).
- The social brain, involved in processing social information about other people (for e.g., their feelings, thoughts, and intentions).
Methods of Research into Brain Structure in Individuals with ASD
Brain structure can be studied at various levels, ranging from, for example:
- The identification of clearly defined component parts, such as the major structural divisions of the brain. (cf. previous blog entitled as ‘The Neurotypical Brain Vs. the Autistic Brain: Neurotypical Brain Structure)
- Through the identification of functional networks.
- To the identification of nuclei, i.e., individual cell groups and nerve tracts.
- To the analysis of the molecular configuration of individual cells or cell types.
Consequently, there are correspondingly several different methods of probing brain structure, as follows [11-12].
1. Post-Mortem or Autopsies Studies:
Invaluable for systematic examination at both macroscopic and microscopic levels of analysis, having the advantage that structural examination can be extended over a prolonged period. However, the disadvantage is that small numbers of cases are available, prone to be older individuals or individuals with multiple disorders that may have affected the brain.
2. Animal Models:
Involve lesioning specific areas of the brain, usually for e.g., the mouse or rat. As well as assessing subsequently the effects on the animal’s behavioral pattern.
3. Insights from Syndromic Forms of ASD:
Various forms of syndromic ASD can reveal abnormalities of likely relevance to autism, for instance, both Fragile-X syndrome and Turner syndrome involve structural abnormalities within the limbic system of the brain. While autistic traits in individuals with tuberous sclerosis are associated with malformations of temporal lobe cortex.
4. Computerized (Axial) Tomography (CT/CAT Scan):
Often called CT scans, used ideally in hospitals and other clinical settings, especially for diagnosis purposes, for e.g., brain tumors and hemorrhaging. Uses X-rays; this allows for multiple sequential X-rays to be taken and the computer is then used to build up a three-dimensional (3D) image of the brain. Applicable for examining bony tissue, but undesirable because of radiation risks. Notably, passing X-rays through healthy individuals, and in particular healthy children, even if such procedures are necessary for diagnosis.
5. Diffusion Tensor Imaging (DTI):
Also known as diffusion MRI, is a relatively new technique based around the process of diffusion, i.e., moving of the molecules, and is used to detect changes in diffusion of water molecules in both grey and white matter in the brain. Thus, this method of brain imaging is particularly suited for examining brain tissue at a more microscopic level than can be achieved with the standard form of sMRI.
6. Structural Magnetic Resonance Imaging (sMRI/MRIs):
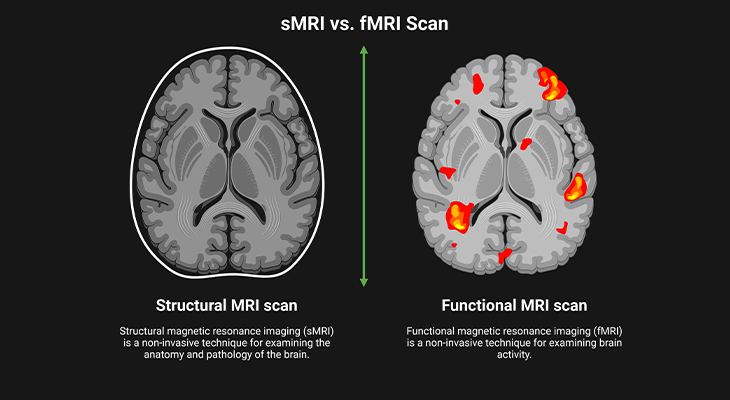
Figure 3. Picturing the Brain: (i) Developments in brain imaging have revolutionized the way we can study the brain. (ii) Structural MRI (sMRI) allows for repeated images to be made of the same brain and so can show how the structure changes over time. (iii) Functional MRI (fMRI) is good at showing us where things are in the brain and what they are doing, but it is not so good at showing us when they are happening. Thus, neuroimaging techniques allow us to visualize brain activity.
Magnetic resonance imaging provides much better means of allowing us to image the brains of healthy children and adults as such without the attendant health risks, which gives sMRI its main advantage over CAT scanning. Uses a machine-generated magnetic field, which resonates in ways that can be used to build up a detailed 3D image of brain structure. sMRI also gives a much clearer picture of the brain; and it can differentiate grey matter and white matter in the brain (Figure 3).
Most of all, this technology has also enabled us for repeated scanning of the same brain and so rendered us the ability to visualize how they develop over a span of time (Figure 3). However, the scanning machine is noisy and claustrophobic, and the individual being examined has to keep still for a longer period of time. This clearly poses a problem with children because most pediatric MRI studies require the ASD individual to lie still for between 5 to 20 minutes. As everyone who works with children will tell you, getting them to lie still even for a few reasonably short periods of time can be extremely difficult!
Besides, the use of the machine is expensive. For all these reasons, studies of individuals with ASD tend to include small numbers of participants, and the fact that few studies include very young or low-functioning individuals unless sedated.
Conclusion
In an infant, the presence of abnormal crossing of cranial growth parameters by head measurements (i.e., an actual measurement out of the normal range) raises the possibilities of a developing central nervous system disorder. As a result, one of the possible disorders in both ‘macrocephaly’ (large head) and ‘microcephaly’ (small head) is a disease entity of the autistic syndrome.
It is widely accepted there exists abnormal connectivity within and between various brain regions and structures. Both hyper- and hypo-connectivity occur, and it is usually thought that hyper-connectivity within local networks is associated with isolated peaks of ability, and while hypo-connectivity between more widely distributed regions or networks is associated with autism-related behavioral anomalies or impairments. Meaning that the autistic brain is not wired up normally.
Anomalous connectivity in the brains of individuals with ASD probably results from abnormalities in the density of grey matter and/or white matter in specific brain regions or structures, i.e., occasionally too much, and sometimes too little. Moreover, abnormalities may vary with age, gender, and complexity of an individual’s autism-related problems.
The developments in brain imaging techniques completely revolutionized the way in which we can study the brain by enabling us to produce images of it in vivo, that is within the living body.
Did You Know? Folate Receptor Autoantibodies (FRAAs) may impede proper folate transport.
Folate (vitamin B9) is very important for your child’s brain development!
During pregnancy, it helps prevent neural tube defects and plays a big role in forming a normal and healthy baby’s brain and spinal cord. Folate also helps cells divide and assists in both DNA and RNA synthesis.
Emerging research suggests that the presence of FRAAs negatively impacts folate transport into the brain.
- Recent studies reveal that a large subgroup of children with autism spectrum disorder (ASD) have FRAAs.
- This suggests that a possible disruption in folate transport across the blood-cerebrospinal fluid (CSF) barrier may potentially influence ASD-linked brain development.
- Screening for the FRAAs in your child should be part of your early intervention strategies.
Is there a test for identifying Folate Receptor Autoantibodies (FRAAs)?
Yes, there is a test – The Folate Receptor Antibody Test (FRAT®) has emerged as a diagnostic tool for detecting the presence of FRAAs.
It is important to screen at an early age or as soon as possible as there may be corrective measures available. Please consult your physician for further information.
To request a test kit, click on the button below.

For information on autism monitoring, screening and testing please read our blog.
References
- Shen MD, Piven J. Brain and behavior development in autism from birth through infancy. Dialogues Clin Neurosci. 2017 Dec;19(4):325-333. doi: 10.31887/DCNS.2017.19.4/mshen. PMID: 29398928; PMCID: PMC5789210.
https://pubmed.ncbi.nlm.nih.gov/29398928/ - Hazlett HC, Gu H, Munsell BC, Kim SH, Styner M, Wolff JJ, Elison JT, Swanson MR, Zhu H, Botteron KN, Collins DL, Constantino JN, Dager SR, Estes AM, Evans AC, Fonov VS, Gerig G, Kostopoulos P, McKinstry RC, Pandey J, Paterson S, Pruett JR, Schultz RT, Shaw DW, Zwaigenbaum L, Piven J; IBIS Network; Clinical Sites; Data Coordinating Center; Image Processing Core; Statistical Analysis. Early brain development in infants at high risk for autism spectrum disorder. Nature. 2017 Feb 15;542(7641):348-351. doi: 10.1038/nature21369. PMID: 28202961; PMCID: PMC5336143.
https://pubmed.ncbi.nlm.nih.gov/28202961/ - Riddle K, Cascio CJ, Woodward ND. Brain structure in autism: a voxel-based morphometry analysis of the Autism Brain Imaging Database Exchange (ABIDE). Brain Imaging Behav. 2017 Apr;11(2):541-551. doi: 10.1007/s11682-016-9534-5. PMID: 26941174; PMCID: PMC5010794.
https://pubmed.ncbi.nlm.nih.gov/26941174/ - Holland D, Chang L, Ernst TM, Curran M, Buchthal SD, Alicata D, Skranes J, Johansen H, Hernandez A, Yamakawa R, Kuperman JM, Dale AM. Structural growth trajectories and rates of change in the first 3 months of infant brain development. JAMA Neurol. 2014 Oct;71(10):1266-74. doi: 10.1001/jamaneurol.2014.1638. PMID: 25111045; PMCID: PMC4940157.https://pubmed.ncbi.nlm.nih.gov/25111045/
- Dubois J, Dehaene-Lambertz G, Kulikova S, Poupon C, Hüppi PS, Hertz-Pannier L. The early development of brain white matter: a review of imaging studies in fetuses, newborns and infants. Neuroscience. 2014 Sep 12;276:48-71. doi: 10.1016/j.neuroscience.2013.12.044. Epub 2013 Dec 28. PMID: 24378955.
https://pubmed.ncbi.nlm.nih.gov/24378955/ - Mottron L, Bouvet L, Bonnel A, Samson F, Burack JA, Dawson M, Heaton P. Veridical mapping in the development of exceptional autistic abilities. Neurosci Biobehav Rev. 2013 Feb;37(2):209-28. doi: 10.1016/j.neubiorev.2012.11.016. Epub 2012 Dec 5. PMID: 23219745.
https://pubmed.ncbi.nlm.nih.gov/23219745/ - Wallace GL, Dankner N, Kenworthy L, Giedd JN, Martin A. Age-related temporal and parietal cortical thinning in autism spectrum disorders. Brain. 2010 Dec;133(Pt 12):3745-54. doi: 10.1093/brain/awq279. Epub 2010 Oct 5. PMID: 20926367; PMCID: PMC2995883.
https://pubmed.ncbi.nlm.nih.gov/20926367/ - Casanova MF, Buxhoeveden DP, Switala AE, Roy E. Minicolumnar pathology in autism. Neurology. 2002 Feb 12;58(3):428-32. doi: 10.1212/wnl.58.3.428. PMID: 11839843.
https://pubmed.ncbi.nlm.nih.gov/11839843/ - Ritvo ER, Freeman BJ, Scheibel AB, Duong T, Robinson H, Guthrie D, Ritvo A. Lower Purkinje cell counts in the cerebella of four autistic subjects: initial findings of the UCLA-NSAC Autopsy Research Report. Am J Psychiatry. 1986 Jul;143(7):862-6. doi: 10.1176/ajp.143.7.862. PMID: 3717426.
https://pubmed.ncbi.nlm.nih.gov/3717426/ - Pelphrey KA, Shultz S, Hudac CM, Vander Wyk BC. Research review: Constraining heterogeneity: the social brain and its development in autism spectrum disorder. J Child Psychol Psychiatry. 2011 Jun;52(6):631-44. doi: 10.1111/j.1469-7610.2010.02349.x. Epub 2011 Jan 19. PMID: 21244421; PMCID: PMC3096715.
https://pubmed.ncbi.nlm.nih.gov/21244421/ - Azhari A, Truzzi A, Neoh MJ, Balagtas JPM, Tan HH, Goh PP, Ang XA, Setoh P, Rigo P, Bornstein MH, Esposito G. A decade of infant neuroimaging research: What have we learned and where are we going? Infant Behav Dev. 2020 Feb;58:101389. doi: 10.1016/j.infbeh.2019.101389. Epub 2019 Nov 25. PMID: 31778859.
https://pubmed.ncbi.nlm.nih.gov/31778859/ - Abbot R, Burkitt E. Child Development and the Brain – From Embryo to Adolescence. 2023. Policy Press and Bristol, University Press, Bristol. UK.
https://policy.bristoluniversitypress.co.uk/child-development-and-the-brain-1


